From $37K to $112K: How We Beat Market Projections by 3X
July 31, 2026 · Lord of the Inns
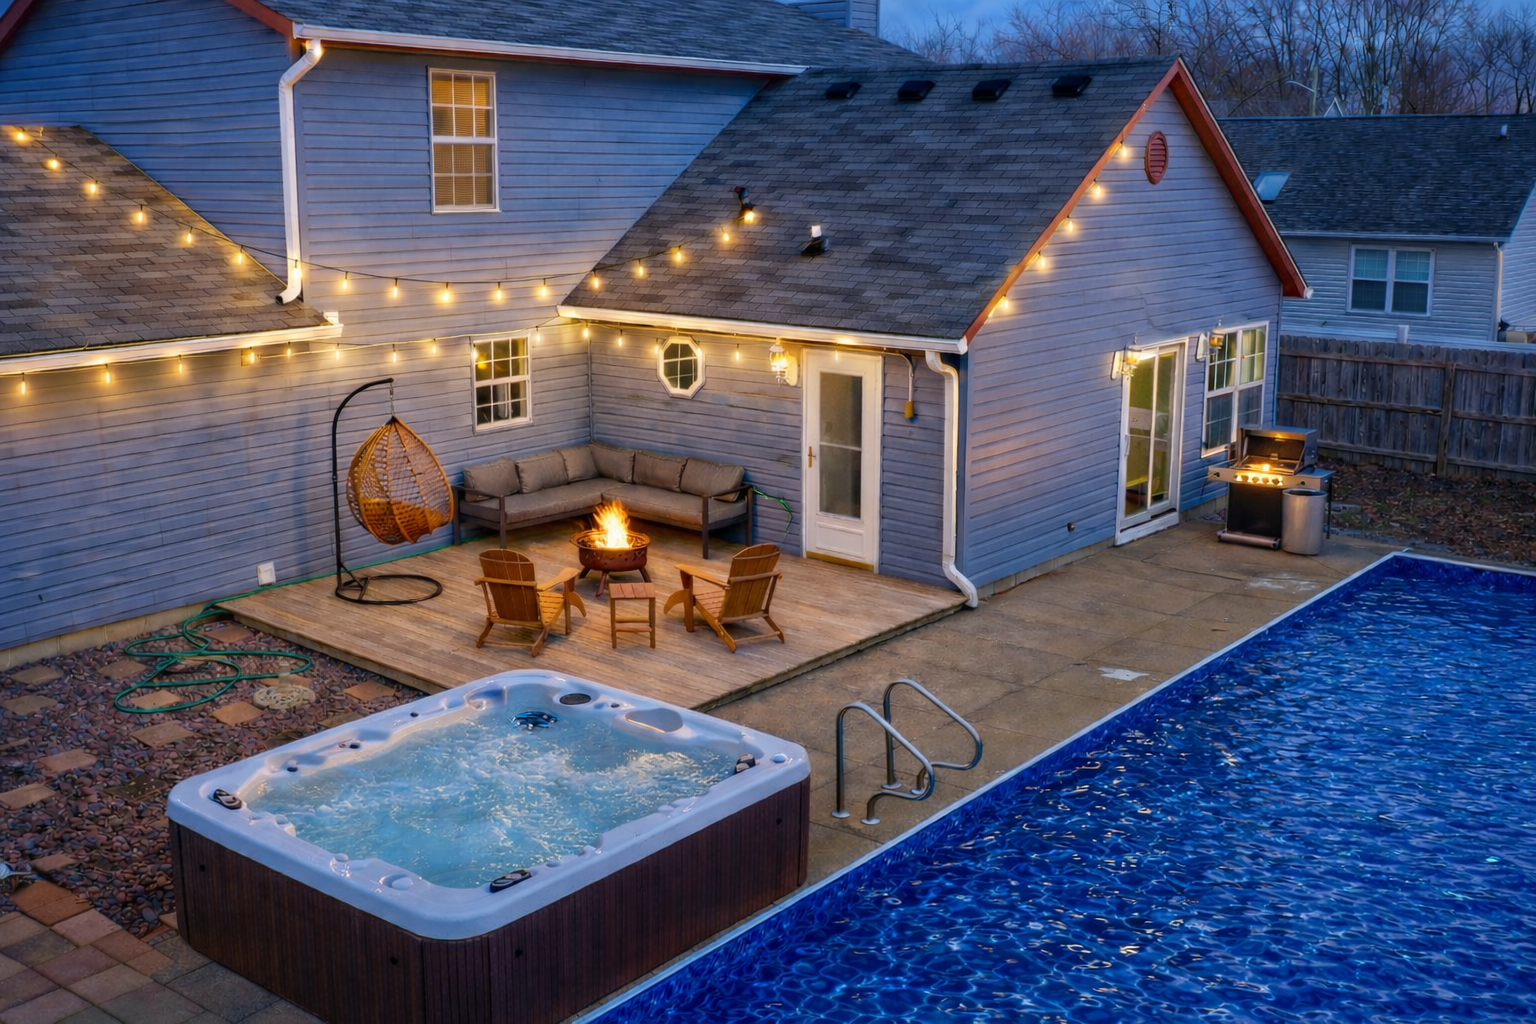
When AirDNA analyzed this property, the data said $37,583 in annual revenue was a reasonable expectation. Moderate potential, nothing remarkable. We looked at the same four walls and saw something different — not just a property, but a positioning opportunity.
Year 1 actual gross earnings: $112,531. Three times the projection.
Here's exactly what we did differently.
Data Gives Direction. Strategy Creates Outcomes.
Algorithm-driven projections like AirDNA's are built on comparable listings as they currently exist — not on what a property could become. That's the gap we look for. A house that "should" earn $37K as a standard rental can earn dramatically more once it's repositioned for a completely different guest audience.
The Three Levers That Moved Revenue
1. Strategic Design & Guest Experience
We invested $35,000 in furnishings to transform the property into a genuine group and family destination — a master bedroom, double queen and twin rooms, a dedicated family room, pool, game room, home theater, kids' play area, and patio entertainment space. This wasn't decorating. It was audience expansion: the property stopped competing for couples and started competing for multi-family group bookings, which command higher nightly rates and longer stays.
2. Shoulder Season Revenue Strategy
Most hosts build their pricing around peak season and let the rest of the calendar coast. We did the opposite — building consistent, year-round bookings through smart weekday pricing, targeted midweek promotions, and optimized minimum-stay rules. The result: an average stay of 3.5 nights and 196 nights booked across the year, not just the summer months.
3. Professional Launch & Revenue Management
An optimized listing strategy and active, dynamic pricing from day one meant the property wasn't just well-designed — it was priced and marketed to actually convert. Average daily rate landed at $580 with a 53% occupancy rate, a combination that reflects deliberate premium positioning rather than a race-to-the-bottom pricing strategy.
The Numbers That Matter to Investors
| Metric | Result |
|---|---|
| Total Cash Invested | $141,375 |
| Gross Earnings (Year 1) | $112,531 |
| Net Payout (after fees) | $101,678 |
| Monthly Average | ~$9,350 |
| Cash-on-Cash Return | 26.6% |
| Payback Period | 3.8 years |
| Cashflow to Revenue Ratio | 33% |
A 26.6% cash-on-cash return and a sub-4-year payback period on a $462,500 property isn't a fluke — it's what happens when acquisition, design, and revenue management are treated as one connected strategy instead of three separate decisions made by three separate people.
We're Not Done Yet
Even after a standout Year 1, we're not coasting on the results. We're adding a private hot tub and a cedar barrel sauna on top of the existing home theater, game room, and kids' play area — premium amenities designed to push nightly rates higher, attract longer stays, and widen the guest audience even further.
2026 Projection with enhanced amenities: $130K+
The Bigger Lesson
Most investors stop at buying the right property. But the property is just the starting point. The real upside lives in how it's positioned, designed, and operated after closing — and that's a strategy, not a guess.
Data tells you where a property sits today. What you do next determines where it ends up.
Curious what your property's real potential looks like — beyond the algorithm's estimate? Let's talk.